
make center line at polygons , using voronoi.
ポリゴンを構成する頂点列から、ポリゴン内に中心線を生成する。中心線の生成にはボロノイ図を用いる。入力としたポリゴン内の長いエッジに対しては細分化を行い、ボロノイ図を生成。生成したボロノイ図を構成するエッジの内、ポリゴン内にあるもののみを抽出すると、そのエッジはポリゴンの中心線のような形状となる。
generate center line in the polygon from the vertex sequence constituting the polygon. at generate we use voronoi diagrams . For long edges in the input polygon, subdivide it and generate Voronoi diagram. When extracting only those in the polygon out of the edges constituting the generated Voronoi diagram, the edge has a shape like the center line of the polygon.
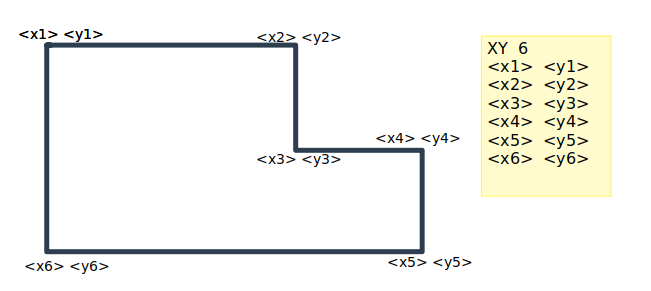
なお、今回扱うポリゴン頂点列のフォーマットしては下記の様なものとしてある。ポリゴンが複数ある場合は、下記を一つのテキストファイルに複数記述することで複数ポリゴンを表現できる。
The format of the polygon vertex sequence handled this time is as follows. If there are multiple polygons, you can express multiple polygons by describing the following in one text file.
|
1 2 3 4 5 6 7 |
XY <point num> <x1> <y1> <x2> <y2> <x3> <y3> <x4> <y5> .... .... |
XY .. 固定(fixed)
point num .. ポリゴンを形成する頂点数
(number of vertives forming a polygon)
x1 y1 .. 頂点1つを表すX-Y座標。
(XY coordinates representing one vertex)
■頂点座標指定のイメージ図(format sample image)
最初に生成する中心線の結果画像を示す。青色がポリゴン図形、白線がボロノイ図、緑線が中心線となる。
At first, show results image of the center line generated. Blue is a polygon figure, a white line is a Voronoi diagram, and a green line is a center line.
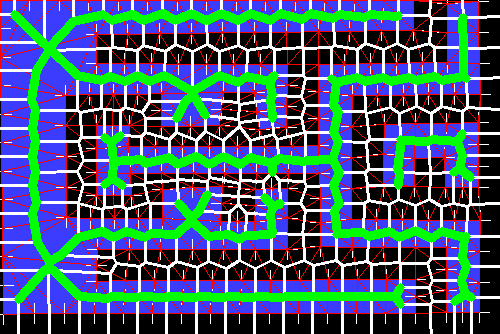
入力としたポリゴン頂点を表すテキストファイルは下記
the input polygon vertex text is as follow URL.
http://hello-python.com/imgs/201901/point_list
■sample code
|
1 2 3 4 5 6 7 8 9 10 11 12 13 14 15 16 17 18 19 20 21 22 23 24 25 26 27 28 29 30 31 32 33 34 35 36 37 38 39 40 41 42 43 44 45 46 47 48 49 50 51 52 53 54 55 56 57 58 59 60 61 62 63 64 65 66 67 68 69 70 71 72 73 74 75 76 77 78 79 80 81 82 83 84 85 86 87 88 89 90 91 92 93 94 95 96 97 98 99 100 101 102 103 104 105 106 107 108 109 110 111 112 113 114 115 116 117 118 119 120 121 122 123 124 125 126 127 128 129 130 131 132 133 134 135 136 137 138 139 140 141 142 143 144 145 146 147 148 149 150 151 152 153 154 155 156 157 158 159 160 161 162 163 164 165 166 167 168 169 170 171 172 173 174 175 176 177 178 179 180 181 182 183 184 185 186 187 188 189 190 191 192 193 194 195 196 197 198 199 200 201 202 203 204 205 206 207 208 209 210 211 212 213 214 215 216 217 218 219 220 221 222 223 224 225 226 227 228 229 230 231 232 233 234 235 236 237 238 239 240 241 242 243 244 245 246 247 248 249 250 251 252 253 254 255 256 257 258 259 260 261 262 263 264 265 266 267 268 269 270 271 272 273 274 275 276 277 278 279 280 281 282 283 284 285 286 287 288 289 290 291 292 293 294 295 296 297 298 299 300 301 302 303 |
import cv2 import sys import math import numpy as np def isEven(num): if num % 2 == 0: return True else: return False def calc_dist(v): x1 = v[0] y1 = v[1] x2 = v[2] y2 = v[3] xx = x2 - x1 yy = y2 - y1 xxyy = xx*xx + yy*yy dist = math.sqrt(xxyy) return dist def split_vect(v,slen): tp = np.empty((0,2), float) dist = calc_dist(v) if dist < slen: x1 = v[0] y1 = v[1] tp = np.append(tp, np.array([[x1,y1]]), axis=0) else: snum = int(math.ceil(dist/slen)) x1 = v[0] y1 = v[1] x2 = v[2] y2 = v[3] xx = x2 - x1 yy = y2 - y1 dx = xx/snum dy = yy/snum for i in range(snum): xx = x1 + dx * i yy = y1 + dy * i tp = np.append(tp, np.array([[xx,yy]]), axis=0) return tp def convert2vector(oarr): varr = np.empty((0,4), float) for i in range(len(oarr)): xx1 = oarr[i][0] yy1 = oarr[i][1] if i != len(oarr) -1: xx2 = oarr[i + 1][0] yy2 = oarr[i + 1][1] else: xx2 = oarr[0][0] yy2 = oarr[0][1] i = i + 1 varr = np.append(varr, np.array([[xx1,yy1,xx2,yy2]]), axis=0) return varr def convert2vector_s(oarrs): """ convert point list to vector list """ varrs = [] for oarr in oarrs: varr = convert2vector(oarr) varrs.append(varr) return varrs def split_longedge(oarrs, slen): """ if 2points distance is long than slen, make new point between 2points. return new point list. """ # ----------------------------------- # convert point list to vector list # ----------------------------------- varrs = convert2vector_s(oarrs) # ----------------------------------- # split long vector, and convert vector list to point list # ----------------------------------- arrs = [] for varr in varrs: arr = np.empty((0,2),float) for p in varr: tp = split_vect(p,slen) arr = np.append(arr, tp, axis=0) arrs.append(arr) return arrs def adjust_picture_size(arrs,width): minx = sys.maxsize miny = sys.maxsize maxx = -minx maxy = -miny for arr in arrs: for p in arr: xx = p[0] yy = p[1] if xx > maxx: maxx = xx if yy > maxy: maxy = yy if xx < minx: minx = xx if yy < miny: miny = yy wx = maxx - minx wy = maxy - miny w = width h = int(w * wy/wx) # adjust coordinates according to pixel size for j in range(len(arrs)): for i in range(len(arrs[j])): xxx = arrs[j][i][0] - minx xxx = xxx * (w-20)/wx arrs[j][i][0] = xxx yyy = arrs[j][i][1] - miny yyy = yyy * (h-20)/wy arrs[j][i][1] = yyy retval = (arrs, h) return retval def isCross(p1,p2,p3,p4): t1 = (p1[0] - p2[0]) * (p3[1] - p1[1]) + (p1[1] - p2[1]) * (p1[0] - p3[0]) t2 = (p1[0] - p2[0]) * (p4[1] - p1[1]) + (p1[1] - p2[1]) * (p1[0] - p4[0]) t3 = (p3[0] - p4[0]) * (p1[1] - p3[1]) + (p3[1] - p4[1]) * (p3[0] - p1[0]) t4 = (p3[0] - p4[0]) * (p2[1] - p3[1]) + (p3[1] - p4[1]) * (p3[0] - p2[0]) return t1*t2<0 and t3*t4<0 def select_inpol(faces, arrs): ret_vect = np.empty((0,4), int) for p in faces: xx = p[len(p) - 1][0] yy = p[len(p) - 1][1] p = np.append(p, np.array([[xx,yy]]), axis=0) varr = convert2vector(p) ret_vect = np.vstack((ret_vect, varr)) maxx = maxy = -sys.maxsize for arr in arrs: for p in arr: if p[0] > maxx: maxx = p[0] if p[1] > maxy: maxy = p[1] maxx = maxx + 100 pol_vector_s = convert2vector_s(arrs) v_in_pol = np.empty((0,4), float) for vv in ret_vect: v_st = (vv[0], vv[1]) v_ed = (maxx, vv[1]) cross_cnt = 0 for pol_vector in pol_vector_s: for pv in pol_vector: p_st = (pv[0], pv[1]) p_ed = (pv[2], pv[3]) if isCross(v_st, v_ed, p_st, p_ed): cross_cnt += 1 if isEven(cross_cnt): continue else: v_st = (vv[2], vv[3]) v_ed = (maxx, vv[3]) cross_cnt = 0 for pol_vector in pol_vector_s: for pv in pol_vector: p_st = (pv[0], pv[1]) p_ed = (pv[2], pv[3]) if isCross(v_st, v_ed, p_st, p_ed): cross_cnt += 1 if isEven(cross_cnt): continue else: v_in_pol = np.append(v_in_pol, [vv], axis=0) return v_in_pol if __name__ == '__main__': #Specify the width of Voronoi image in pixel size. Height is #calculated automatically from input data and specified width. width = 500 #------------------- #read input data and stack at ndarray(oarr). #------------------- in_data = open("./point_list") lines = in_data.readlines() oarr = np.empty((0,2), float) oarrs = [] pnum = cnt = 0 for i in range(len(lines)): lines[i].strip() jj = lines[i].split() if jj[0] == "XY": pnum = int(jj[1]) else: xx = float(jj[0]) yy = float(jj[1]) oarr = np.append(oarr, np.array([[xx,yy]]), axis=0) cnt += 1 print (pnum,cnt) if cnt == pnum: oarrs.append(oarr) oarr = np.empty((0,2), float) cnt = 0 i = i + 1 #------------------- #split long edge. output is arr. #------------------- split_length = 0.5 arrs = split_longedge(oarrs, split_length) #------------------- #adjust point list coodinate for picture size. output is pts. #------------------- ret = adjust_picture_size(arrs,width) pts_s = ret[0] hight = ret[1] #------------------- #Draw Filled polygon contour. #------------------- img = np.zeros((hight, width, 3), np.uint8) for pts in pts_s: arr0 = np.empty((0,2), int) for p in pts: xx = int(p[0]) yy = int(p[1]) arr0 = np.append(arr0, np.array([[xx,yy]]), axis=0) cv2.fillPoly(img, [arr0], (255, 60, 60)) cv2.imwrite('001_c_pattern_contour.png', img) #------------------- #Draw polygon point mark #------------------- img_draw = img.copy() for pts in pts_s: for p in pts: nnn = np.array([ int(p[0]), int(p[1]) ]) cv2.drawMarker(img_draw, tuple(nnn), (255, 255, 255),\ thickness=1) cv2.imwrite('002_c_point_marker.png', img_draw) #------------------- #Make subdivision surface. #------------------- rect = (0, 0, width, hight) subdiv = cv2.Subdiv2D(rect) for pts in pts_s: for p in pts: #print(p) subdiv.insert((p[0], p[1])) triangles = subdiv.getTriangleList() pols = triangles.reshape(-1, 3, 2) cv2.polylines(img_draw, pols.astype(int), True, (0, 0, 255),\ thickness=1) cv2.imwrite('003_c_delaunay_traiangle.png', img_draw) #------------------- #Make voronoi picture. #------------------- faces, centers = subdiv.getVoronoiFacetList([]) cv2.polylines(img_draw, [f.astype(int) for f in faces], True,\ (255, 255, 255), thickness=2) cv2.imwrite('004_c_voronoi.png', img_draw) #------------------- #select polygon inner edge from voronoi img #------------------- vlist = select_inpol(faces, arrs) for p in vlist: cv2.line(img_draw, (int(p[0]), int(p[1])), (int(p[2]), int(p[3])),\ (0,255,0),thickness=7) cv2.imwrite('005_c_inpol_vol_pnt.png', img_draw) |