import cv2
import sys
import math
import numpy as np
def isEven(num):
if num % 2 == 0:
return True
else:
return False
def calc_dist(v):
x1 = v[0]
y1 = v[1]
x2 = v[2]
y2 = v[3]
xx = x2 - x1
yy = y2 - y1
xxyy = xx*xx + yy*yy
dist = math.sqrt(xxyy)
return dist
def split_vect(v,slen):
tp = np.empty((0,2), float)
dist = calc_dist(v)
if dist < slen:
x1 = v[0]
y1 = v[1]
tp = np.append(tp, np.array([[x1,y1]]), axis=0)
else:
snum = int(math.ceil(dist/slen))
x1 = v[0]
y1 = v[1]
x2 = v[2]
y2 = v[3]
xx = x2 - x1
yy = y2 - y1
dx = xx/snum
dy = yy/snum
for i in range(snum):
xx = x1 + dx * i
yy = y1 + dy * i
tp = np.append(tp, np.array([[xx,yy]]), axis=0)
return tp
def convert2vector(oarr):
varr = np.empty((0,4), float)
for i in range(len(oarr)):
xx1 = oarr[i][0]
yy1 = oarr[i][1]
if i != len(oarr) -1:
xx2 = oarr[i + 1][0]
yy2 = oarr[i + 1][1]
else:
xx2 = oarr[0][0]
yy2 = oarr[0][1]
i = i + 1
varr = np.append(varr, np.array([[xx1,yy1,xx2,yy2]]), axis=0)
return varr
def convert2vector_s(oarrs):
"""
convert point list to vector list
"""
varrs = []
for oarr in oarrs:
varr = convert2vector(oarr)
varrs.append(varr)
return varrs
def split_longedge(oarrs, slen):
"""
if 2points distance is long than slen,
make new point between 2points.
return new point list.
"""
# -----------------------------------
# convert point list to vector list
# -----------------------------------
varrs = convert2vector_s(oarrs)
# -----------------------------------
# split long vector, and convert vector list to point list
# -----------------------------------
arrs = []
for varr in varrs:
arr = np.empty((0,2),float)
for p in varr:
tp = split_vect(p,slen)
arr = np.append(arr, tp, axis=0)
arrs.append(arr)
return arrs
def adjust_picture_size(arrs,width):
minx = sys.maxsize
miny = sys.maxsize
maxx = -minx
maxy = -miny
for arr in arrs:
for p in arr:
xx = p[0]
yy = p[1]
if xx > maxx:
maxx = xx
if yy > maxy:
maxy = yy
if xx < minx:
minx = xx
if yy < miny:
miny = yy
wx = maxx - minx
wy = maxy - miny
w = width
h = int(w * wy/wx)
# adjust coordinates according to pixel size
for j in range(len(arrs)):
for i in range(len(arrs[j])):
xxx = arrs[j][i][0] - minx
xxx = xxx * (w-20)/wx
arrs[j][i][0] = xxx
yyy = arrs[j][i][1] - miny
yyy = yyy * (h-20)/wy
arrs[j][i][1] = yyy
retval = (arrs, h)
return retval
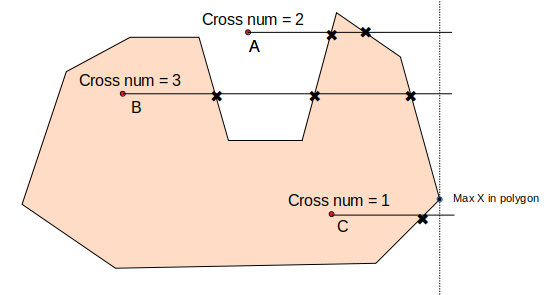
def isCross(p1,p2,p3,p4):
t1 = (p1[0] - p2[0]) * (p3[1] - p1[1]) + (p1[1] - p2[1]) * (p1[0] - p3[0])
t2 = (p1[0] - p2[0]) * (p4[1] - p1[1]) + (p1[1] - p2[1]) * (p1[0] - p4[0])
t3 = (p3[0] - p4[0]) * (p1[1] - p3[1]) + (p3[1] - p4[1]) * (p3[0] - p1[0])
t4 = (p3[0] - p4[0]) * (p2[1] - p3[1]) + (p3[1] - p4[1]) * (p3[0] - p2[0])
return t1*t2<0 and t3*t4<0
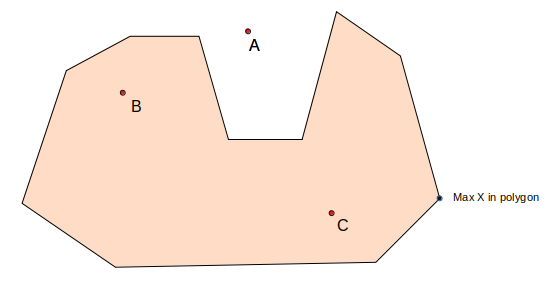
def select_inpol(faces, arrs):
ret_vect = np.empty((0,4), int)
for p in faces:
xx = p[len(p) - 1][0]
yy = p[len(p) - 1][1]
p = np.append(p, np.array([[xx,yy]]), axis=0)
varr = convert2vector(p)
ret_vect = np.vstack((ret_vect, varr))
maxx = maxy = -sys.maxsize
for arr in arrs:
for p in arr:
if p[0] > maxx:
maxx = p[0]
if p[1] > maxy:
maxy = p[1]
maxx = maxx + 100
pol_vector_s = convert2vector_s(arrs)
v_in_pol = np.empty((0,4), float)
for vv in ret_vect:
v_st = (vv[0], vv[1])
v_ed = (maxx, vv[1])
cross_cnt = 0
for pol_vector in pol_vector_s:
for pv in pol_vector:
p_st = (pv[0], pv[1])
p_ed = (pv[2], pv[3])
if isCross(v_st, v_ed, p_st, p_ed):
cross_cnt += 1
if isEven(cross_cnt):
continue
else:
v_st = (vv[2], vv[3])
v_ed = (maxx, vv[3])
cross_cnt = 0
for pol_vector in pol_vector_s:
for pv in pol_vector:
p_st = (pv[0], pv[1])
p_ed = (pv[2], pv[3])
if isCross(v_st, v_ed, p_st, p_ed):
cross_cnt += 1
if isEven(cross_cnt):
continue
else:
v_in_pol = np.append(v_in_pol, [vv], axis=0)
return v_in_pol
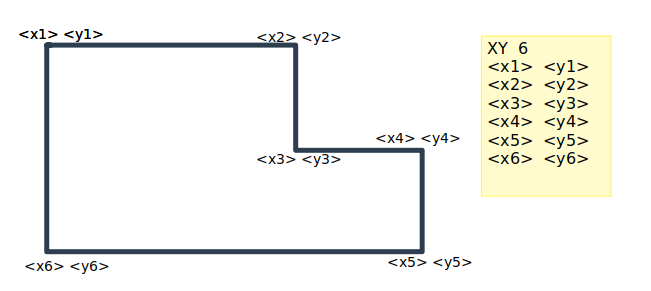
if __name__ == '__main__':
#Specify the width of Voronoi image in pixel size. Height is
#calculated automatically from input data and specified width.
width = 500
#-------------------
#read input data and stack at ndarray(oarr).
#-------------------
in_data = open("./point_list")
lines = in_data.readlines()
oarr = np.empty((0,2), float)
oarrs = []
pnum = cnt = 0
for i in range(len(lines)):
lines[i].strip()
jj = lines[i].split()
if jj[0] == "XY":
pnum = int(jj[1])
else:
xx = float(jj[0])
yy = float(jj[1])
oarr = np.append(oarr, np.array([[xx,yy]]), axis=0)
cnt += 1
print (pnum,cnt)
if cnt == pnum:
oarrs.append(oarr)
oarr = np.empty((0,2), float)
cnt = 0
i = i + 1
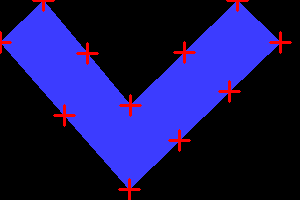
#-------------------
#split long edge. output is arr.
#-------------------
split_length = 0.5
arrs = split_longedge(oarrs, split_length)
#-------------------
#adjust point list coodinate for picture size. output is pts.
#-------------------
ret = adjust_picture_size(arrs,width)
pts_s = ret[0]
hight = ret[1]
#-------------------
#Draw Filled polygon contour.
#-------------------
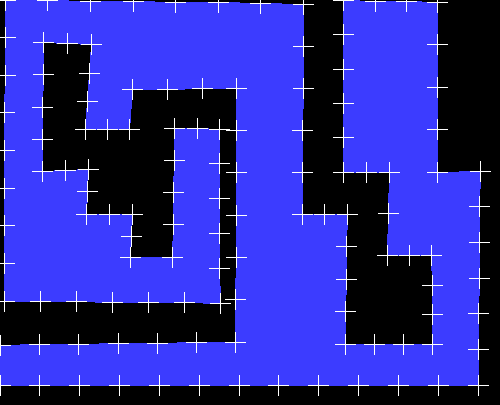
img = np.zeros((hight, width, 3), np.uint8)
for pts in pts_s:
arr0 = np.empty((0,2), int)
for p in pts:
xx = int(p[0])
yy = int(p[1])
arr0 = np.append(arr0, np.array([[xx,yy]]), axis=0)
cv2.fillPoly(img, [arr0], (255, 60, 60))
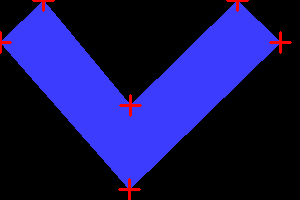
cv2.imwrite('001_c_pattern_contour.png', img)
#-------------------
#Draw polygon point mark
#-------------------
img_draw = img.copy()
for pts in pts_s:
for p in pts:
nnn = np.array([ int(p[0]), int(p[1]) ])
cv2.drawMarker(img_draw, tuple(nnn), (255, 255, 255),\
thickness=1)
cv2.imwrite('002_c_point_marker.png', img_draw)
#-------------------
#Make subdivision surface.
#-------------------
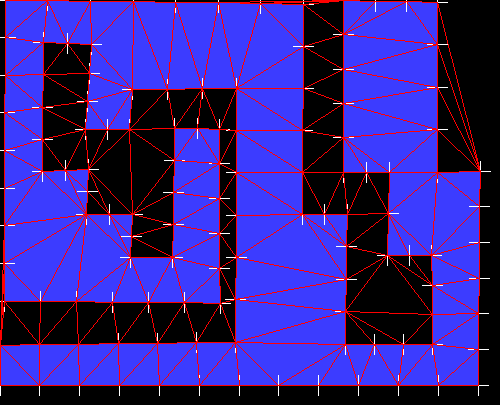
rect = (0, 0, width, hight)
subdiv = cv2.Subdiv2D(rect)
for pts in pts_s:
for p in pts:
#print(p)
subdiv.insert((p[0], p[1]))
triangles = subdiv.getTriangleList()
pols = triangles.reshape(-1, 3, 2)
cv2.polylines(img_draw, pols.astype(int), True, (0, 0, 255),\
thickness=1)
cv2.imwrite('003_c_delaunay_traiangle.png', img_draw)
#-------------------
#Make voronoi picture.
#-------------------
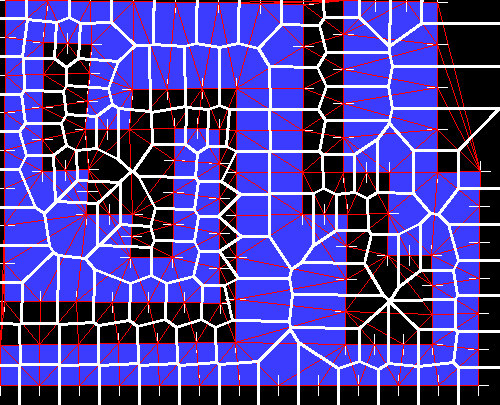
faces, centers = subdiv.getVoronoiFacetList([])
cv2.polylines(img_draw, [f.astype(int) for f in faces], True,\
(255, 255, 255), thickness=2)
cv2.imwrite('004_c_voronoi.png', img_draw)
#-------------------
#select polygon inner edge from voronoi img
#-------------------
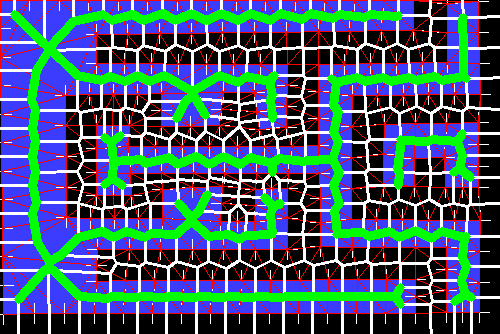
vlist = select_inpol(faces, arrs)
for p in vlist:
cv2.line(img_draw, (int(p[0]), int(p[1])), (int(p[2]), int(p[3])),\
(0,255,0),thickness=7)
cv2.imwrite('005_c_inpol_vol_pnt.png', img_draw)