python3でopenCVのインストールメモ
OSはUbuntu 18.04.5 LTS
コマンドは下記
%sudo apt install python3-opencv

Leave record about python coding
python3でopenCVのインストールメモ
OSはUbuntu 18.04.5 LTS
コマンドは下記
%sudo apt install python3-opencv
getDaimlerPeopleDetectorを使っての人検出。getDefaultPeopleDetectorを使った人検出は
こちら。
■入力画像
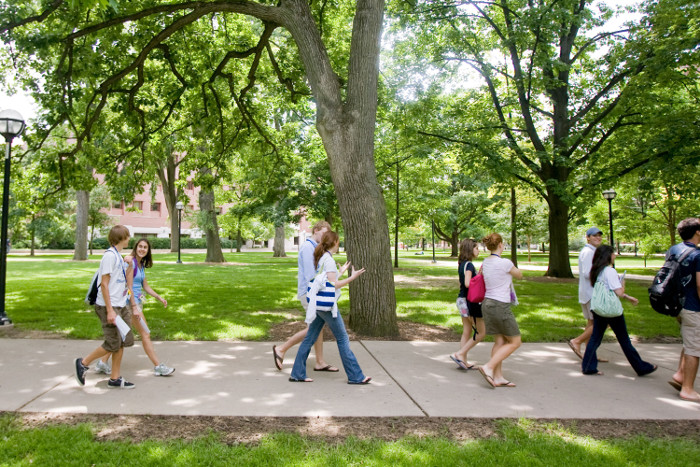
■サンプルコード
|
1 2 3 4 5 6 7 8 9 10 11 12 13 14 15 16 17 18 19 20 21 22 23 24 25 |
import cv2 im = cv2.imread("people.jpg") # Calculation of HoG feature quantity hog = cv2.HOGDescriptor((48,96), (16,16), (8,8), (8,8), 9) #Create Human Identifier with HoG feature quantity + SVM hog.setSVMDetector(cv2.HOGDescriptor_getDaimlerPeopleDetector()) #widStride :Window movement amount #padding :Extended range around the input image #scale :scale hogParams = {'winStride': (8, 8), 'padding': (32, 32), 'scale': 1.05} #Detected person coordinate by the created identifier device human, r = hog.detectMultiScale(im, **hogParams) #Surround a person's area with a red rectangle for (x, y, w, h) in human: cv2.rectangle(im, (x, y),(x+w, y+h),(0,50,255), 3) #show image cv2.imshow("results human detect by getDaimlerPeopleDetector",im) cv2.waitKey(0) |
■実行結果
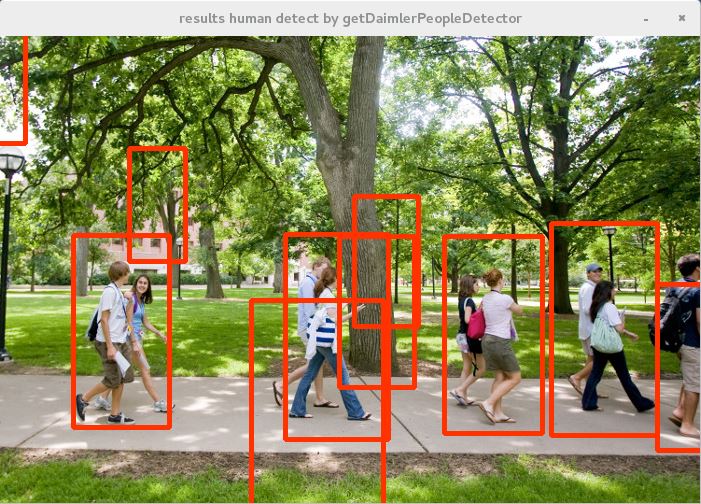
誤検出はあるが、getDefaultPeopleDetectorでの検出に比べると漏れは少なくなる印象。
HOGDescriptorは被探索画像を64 * 128 などの単位でスキャンし、8 * 8などのピクセルを移動させてHOG特徴量の抽出を行う。HOG特徴量は領域内の勾配方向ごとの勾配強度を計算してそれをヒストグラムにしたものらしい。画像中の輝度変化を抽出していることになる。
SVMは入力が正解か不正解を分類する分類器。大量のデータとラベルの組から正解ラベルのデータ、不正解ラベルのデータを学習し正解と不正解の境界線を引く。
opencvにはすでに学習済みの人識別器が同梱されており、これを使って人の検出を行ってみる。
■入力画像

■サンプルコード
|
1 2 3 4 5 6 7 8 9 10 11 12 13 14 15 16 17 18 19 20 21 22 23 24 25 |
import cv2 im = cv2.imread("people.jpg") # Calculation of HoG feature quantity hog = cv2.HOGDescriptor() #Create Human Identifier with HoG feature quantity + SVM hog.setSVMDetector(cv2.HOGDescriptor_getDefaultPeopleDetector()) #widStride :Window movement amount #padding :Extended range around the input image #scale :scale hogParams = {'winStride': (8, 8), 'padding': (32, 32), 'scale': 1.05} #Detected person coordinate by the created identifier device human, r = hog.detectMultiScale(im, **hogParams) #Surround a person's area with a red rectangle for (x, y, w, h) in human: cv2.rectangle(im, (x, y),(x+w, y+h),(0,50,255), 3) #show image cv2.imshow("results human detect by def detector",im) cv2.waitKey(0) |
■実行結果
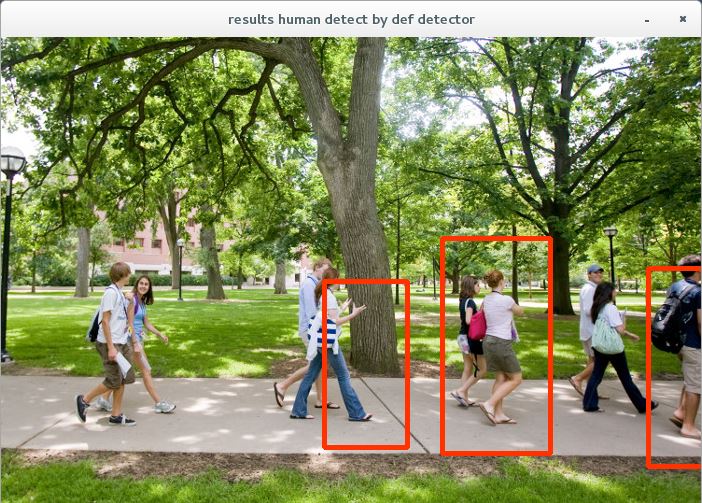
検出漏れはあるが、とりあえず機能はしている様子。opencvの人認識器には今回試したgetDefaultPeopleDetector以外にgetDaimlerPeopleDetectorという認識器が同梱されている。これについては次回以降で実験してみる。
HOG Descriptor scans the search image by units such as 64 x 128, moves pixels such as 8 x 8, and extracts the HOG feature amount. It seems that the HOG feature quantity is calculated by calculating the gradient strength for each gradient direction in the region and making it a histogram. The luminance change in the image is extracted.
SVM is a classifier that classifies incorrect answers or incorrect answers. Learn the data of the correct label and the data of the incorrect label from the large amount of data and the set of labels and draw the boundary line between the correct answer and incorrect answer.
Opencv is already shipped with a learned person identifier, and try to detect people using it.
Results:Detection is insufficient, but it seems that it is functioning for the time being. In this time, we tried getDefaultPeopleDetector on human recognition device of opencv and recognition device called getDaimlerPeopleDetector is bundled. I will experiment about this next time.
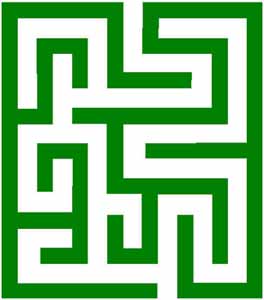
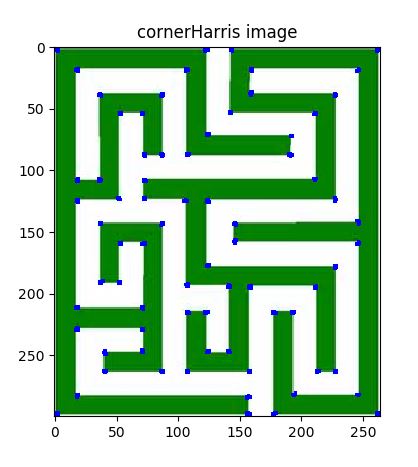
コーナー部の特徴量抽出をする方法としてMoravecの方法や、Harrisの方法というものがある。検出のためのアルゴリズムは難解で自分には理解できず。とりあえず実行テストした結果とコードを乗せる。しっかりとコーナー部分を抽出できていることがわかる。
■入力画像
■サンプルコード
|
1 2 3 4 5 6 7 8 9 10 11 12 13 14 15 |
import cv2 import numpy as np from matplotlib import pyplot as plt img = cv2.imread('maze.jpg') gray = cv2.cvtColor(img,cv2.COLOR_BGR2GRAY) gray = np.float32(gray) dst = cv2.cornerHarris(gray,2,3,0.04) dst = cv2.dilate(dst,None) img[dst>0.01*dst.max()]=[0,0,255] plt.imshow(img) plt.title('cornerHarris image') plt.show() |
■実行結果
■サンプルコード
|
1 2 3 4 5 6 7 8 9 10 11 12 13 14 15 16 |
import cv2 import numpy as np from matplotlib import pyplot as plt img = cv2.imread('maru.png',0) edges = cv2.Canny(img,100,200) plt.subplot(121) plt.imshow(img,cmap = 'gray') plt.title('input image') plt.subplot(122) plt.imshow(edges,cmap = 'gray') plt.title('canny image') plt.show() |
■実行結果
| HoughCircles(image, circles, method, dp, minDist, param1, param2, minRadius, maxRadius) |
|---|
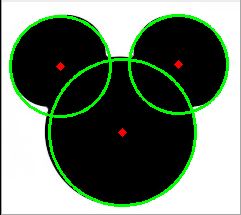
ハフ変換を用いて画像内から円を検出する
| 項目 | 内容 |
|---|---|
| image | 8ビット,シングルチャンネル,グレースケールの入力画像 |
| circles | 検出された円を出力するベクトル |
| method | 現在のところCV_HOUGH_GRADIENT メソッドのみが実装 |
| dp | 画像分解能に対する投票分解能の比率の逆数 |
| minDist | 検出される円の中心同士の最小距離.このパラメータが小さすぎると,正しい円の周辺に別の円が複数誤って検出される |
| param1 | 手法依存の 1 番目のパラメータ. CV_HOUGH_GRADIENT の場合は, Canny() エッジ検出器に渡される2つの閾値の内,大きい方の閾値を表す |
| param2 | 手法依存の 2 番目のパラメータ. CV_HOUGH_GRADIENT の場合は,円の中心を検出する際の投票数の閾値を表す.これが小さくなるほど,より多くの誤検出が起こる可能性がある |
| minRadius | 円の半径の最小値 |
| maxRadius | 円の半径の最大値 |
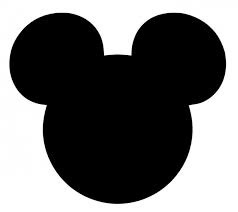
■入力画像
■処理コード
|
1 2 3 4 5 6 7 8 9 10 11 12 13 14 15 16 17 18 19 20 |
import cv2 import cv2.cv as cv import numpy as np img = cv2.imread('mm.jpg',0) img = cv2.medianBlur(img,5) cimg = cv2.cvtColor(img,cv2.COLOR_GRAY2BGR) circles = cv2.HoughCircles(img,cv.CV_HOUGH_GRADIENT ,1,20, param1=50,param2=30,minRadius=0,maxRadius=0) circles = np.uint16(np.around(circles)) for i in circles[0,:]: cv2.circle(cimg,(i[0],i[1]),i[2],(0,255,0),2) cv2.circle(cimg,(i[0],i[1]),2,(0,0,255),3) cv2.imshow('detected circles',cimg) cv2.waitKey(0) cv2.destroyAllWindows() cv2.imwrite('output.jpg',cimg) |
■結果
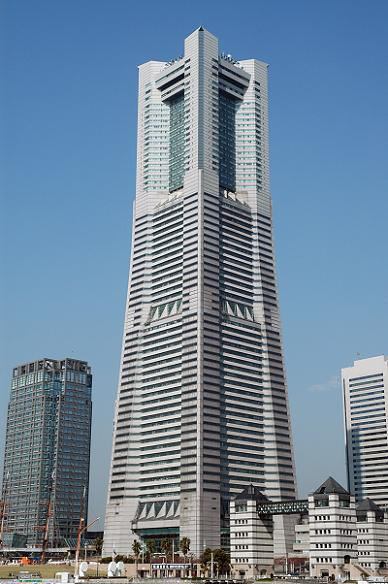
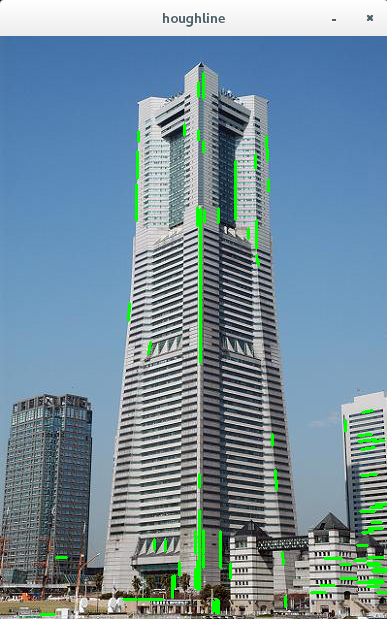
ハフ変換は与えられたパラメータから全条件を計算し直線を求めるのに対し、確率的ハフ変換はある程度の当たりをつけて計算し、負荷を軽くする。
| HoughLinesP(image, lines, double rho, double theta, int threshold, double minLineLength=0, double maxLineGap=0) |
|---|
■入力画像
■処理コード
|
1 2 3 4 5 6 7 8 9 10 11 12 13 14 15 |
import cv2 import numpy as np img = cv2.imread('buil.jpg') gray = cv2.cvtColor(img,cv2.COLOR_BGR2GRAY) edges = cv2.Canny(gray,50,150,apertureSize = 3) minLineLength = 100 maxLineGap = 10 lines = cv2.HoughLinesP(edges,1,np.pi/180,100,minLineLength,maxLineGap) for x1,y1,x2,y2 in lines[0]: cv2.line(img,(x1,y1),(x2,y2),(0,255,0),2) cv2.imshow("houghline",img) cv2.waitKey(0) cv2.destroyWindow() |
■結果
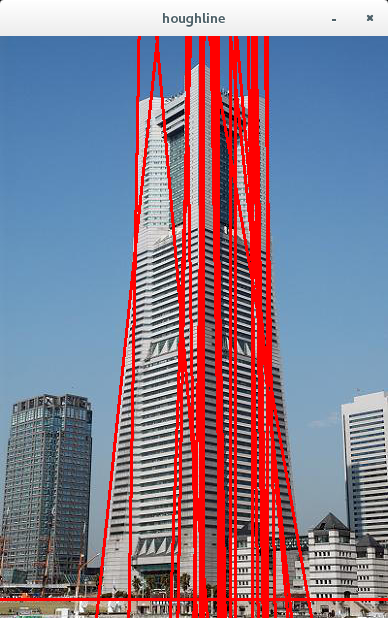
ハフ変換は画像の中にある直線形状や円形状を検出する際に用いられる手法の一つ。opencvではHoughLinesという関数が用意されており、これを使うことで検出が容易となる(計算付加は指定するパラメータの精度により異なる)。
| HoughLines(image, lines, rho, theta, threshold, srn, stn) |
|---|
| 項目 | 内容 |
|---|---|
| image | 8ビット,シングルチャンネルの2値入力画像.この画像は関数により書き換えられる可能性がある |
| lines | 検出された直線が出力されるベクトル.各直線は,2要素のベクトル (rho, theta) で表現される. rho は原点(画像の左上コーナー)からの距離, theta はラジアン単位で表される直線の回転角度 |
| rho | ピクセル単位で表される投票空間の距離分解能 |
| theta | ラジアン単位で表される投票空間の角度分解能 |
| threshold | 投票の閾値パラメータ.十分な票を得た直線のみが出力される |
| srn | マルチスケールハフ変換において,距離分解能 rho の除数となる値.投票空間の粗い距離分解能は rho となり,細かい分解能は rho/srn となる.もし srn=0 かつ stn=0 の場合は,古典的ハフ変換が利用される.そうでない場合は,両方のパラメータが正値である必要がある |
| stn | マルチスケールハフ変換において,角度分解能 theta の除数となる値 |
■入力画像

■処理コード
|
1 2 3 4 5 6 7 8 9 10 11 12 13 14 15 16 17 18 19 20 21 22 23 |
import cv2 import numpy as np img = cv2.imread('buil.jpg') gray = cv2.cvtColor(img,cv2.COLOR_BGR2GRAY) edges = cv2.Canny(gray,50,150,apertureSize = 3) lines = cv2.HoughLines(edges,1,np.pi/180,200) for rho,theta in lines[0]: a = np.cos(theta) b = np.sin(theta) x0 = a*rho y0 = b*rho x1 = int(x0 + 1000*(-b)) y1 = int(y0 + 1000*(a)) x2 = int(x0 - 1000*(-b)) y2 = int(y0 - 1000*(a)) cv2.line(img,(x1,y1),(x2,y2),(0,0,255),2) cv2.imshow("houghline",img) cv2.waitKey(0) cv2.destroyWindow() |
■結果
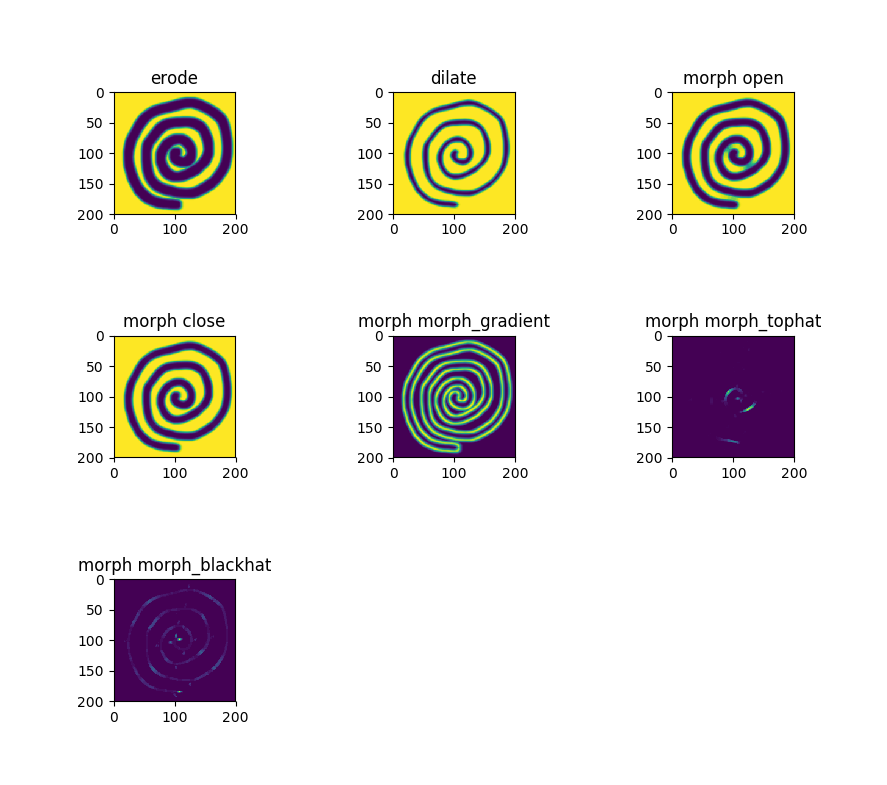
画像からのノイズ除去、テクスチャ解析等に使用される演算手法。背景の画素と隣接する物体の画素の関係を膨張(dilate)、収縮(erosion)させることで画像の2値化、グレースケール化を行うことができる。
openCVではmorphologyExのメソッドによりさらに以下の処理が可能。
オープニング処理 収縮した結果に対して同じ回数だけ膨張する
クロージング処理 膨張した結果に対して同じ回数だけ収縮する
グラジエント処理 膨張した結果から収縮した結果を差し引く
トップハット処理 元画像からオープニングした画像を差し引く
ブラックハット処理 クロージングした画像から元画像を差し引く
■入力画像

■処理コード
|
1 2 3 4 5 6 7 8 9 10 11 12 13 14 15 16 17 18 19 20 21 22 23 24 25 26 27 28 29 30 31 32 33 34 35 36 37 38 39 |
import cv2 import numpy as np import matplotlib.pyplot as plt img = cv2.imread('maru.png',0) kernel = np.ones((5,5),np.uint8) erode = cv2.erode(img,kernel,iterations = 1) dilate = cv2.dilate(img,kernel,iterations = 1) morph_open = cv2.morphologyEx(img, cv2.MORPH_OPEN, kernel) morph_close = cv2.morphologyEx(img, cv2.MORPH_CLOSE, kernel) morph_gradient = cv2.morphologyEx(img, cv2.MORPH_GRADIENT, kernel) morph_tophat = cv2.morphologyEx(img, cv2.MORPH_TOPHAT, kernel) morph_blackhat = cv2.morphologyEx(img, cv2.MORPH_BLACKHAT, kernel) plt.subplots_adjust(wspace=1.0, hspace=1.0) plt.subplot(331) plt.title("erode") plt.imshow(erode) plt.subplot(332) plt.title("dilate") plt.imshow(dilate) plt.subplot(333) plt.title("morph open") plt.imshow(morph_open) plt.subplot(334) plt.title("morph close") plt.imshow(morph_close) plt.subplot(335) plt.title("morph morph_gradient") plt.imshow(morph_gradient) plt.subplot(336) plt.title("morph morph_tophat") plt.imshow(morph_tophat) plt.subplot(337) plt.title("morph morph_blackhat") plt.imshow(morph_blackhat) plt.show() |
■処理結果
| 対象 | 説明 |
| 信号 | 縦軸を振幅、横軸を時間とした波形情報を周波数の分布に変換する |
| 画像 | 縦軸を1ピクセルあたりの画素強度、横軸を座標として、ピクセル間の強度値変化を周波数分布に変換する |
画像に対するフーリエ変換のピクセルあたりの画素強度の例として、1×7サイズのグレースケール画像を考える。例えば下記のようなもの(ここでは視認性のため、拡大した画像で表示)。

画素強度値は明るいほど値が大きい。つまりグレースケールの255階調で考えれば、白い箇所は255、黒い箇所は0の値となる。先ほどの画像にピクセル毎に強度値を重ねて表示すると下記のような値を持つ。

上記画像の強度値を、縦軸を1ピクセルあたりの画素強度、横軸を座標として表しなおしたグラフが下記。画像に対するフーリエ変換はこのグラフに対して行っていることになる
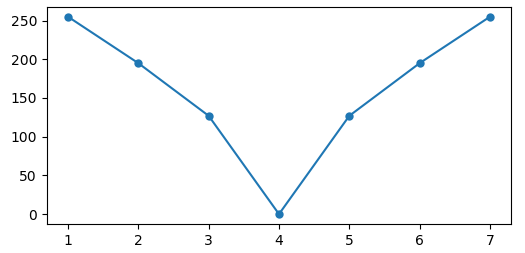
ただし通常画像はもっと大きなサイズであり、1ピクセル高ということはない。そのため、実際には各ピクセル行に対してフーリエ変換を行う。各行へのフーリエ変換の実施後はデータを転置し、転置後のデータに対して再度各行に対してフーリエ変換を実施する。その後再度転置を行いデータの向きを元に戻す作業を行う。これで画像に対する2次元フーリエ変換となる。

ここまでの内容をpythonコードにしたものが下記。
|
1 2 3 4 5 6 7 8 9 10 11 12 13 14 15 16 17 18 19 20 21 22 23 24 25 26 27 28 29 30 31 32 33 |
import cv2 import numpy as np import matplotlib.pyplot as plt from PIL import Image image = cv2.imread("mt_fuji.jpg", 0) h, w = image.shape ff = np.zeros(image.shape, dtype=complex) for i in range(h): ff[i] = np.fft.fft(image[i]) ff = ff.T for i in range(w): ff[i] = np.fft.fft(ff[i]) ff = ff.T fimg = np.fft.fftshift(ff) mag = 20*np.log(np.abs(fimg)) dst = np.fft.ifft2(ff) dst = dst.real dst = np.uint8(dst) plt.subplot(221) plt.title("original") plt.imshow(image, cmap = 'gray') plt.subplot(222) plt.title("power spectrum") plt.imshow(mag, cmap = 'gray') plt.subplot(223) plt.title("fft and invers fft result") plt.imshow(dst, cmap = 'gray') plt.show() |
