作業メモ
まずはUbuntuにてeasy_installをpipをインストール
easy_installのインストール
$ sudo apt-get install python-setuptools
pipのインストール
$ sudo apt-get install python-pip
pipを使ってpyQtGraphをインストール
$ sudo pip install pyqtgraph

Leave record about python coding
作業メモ
まずはUbuntuにてeasy_installをpipをインストール
easy_installのインストール
$ sudo apt-get install python-setuptools
pipのインストール
$ sudo apt-get install python-pip
pipを使ってpyQtGraphをインストール
$ sudo pip install pyqtgraph
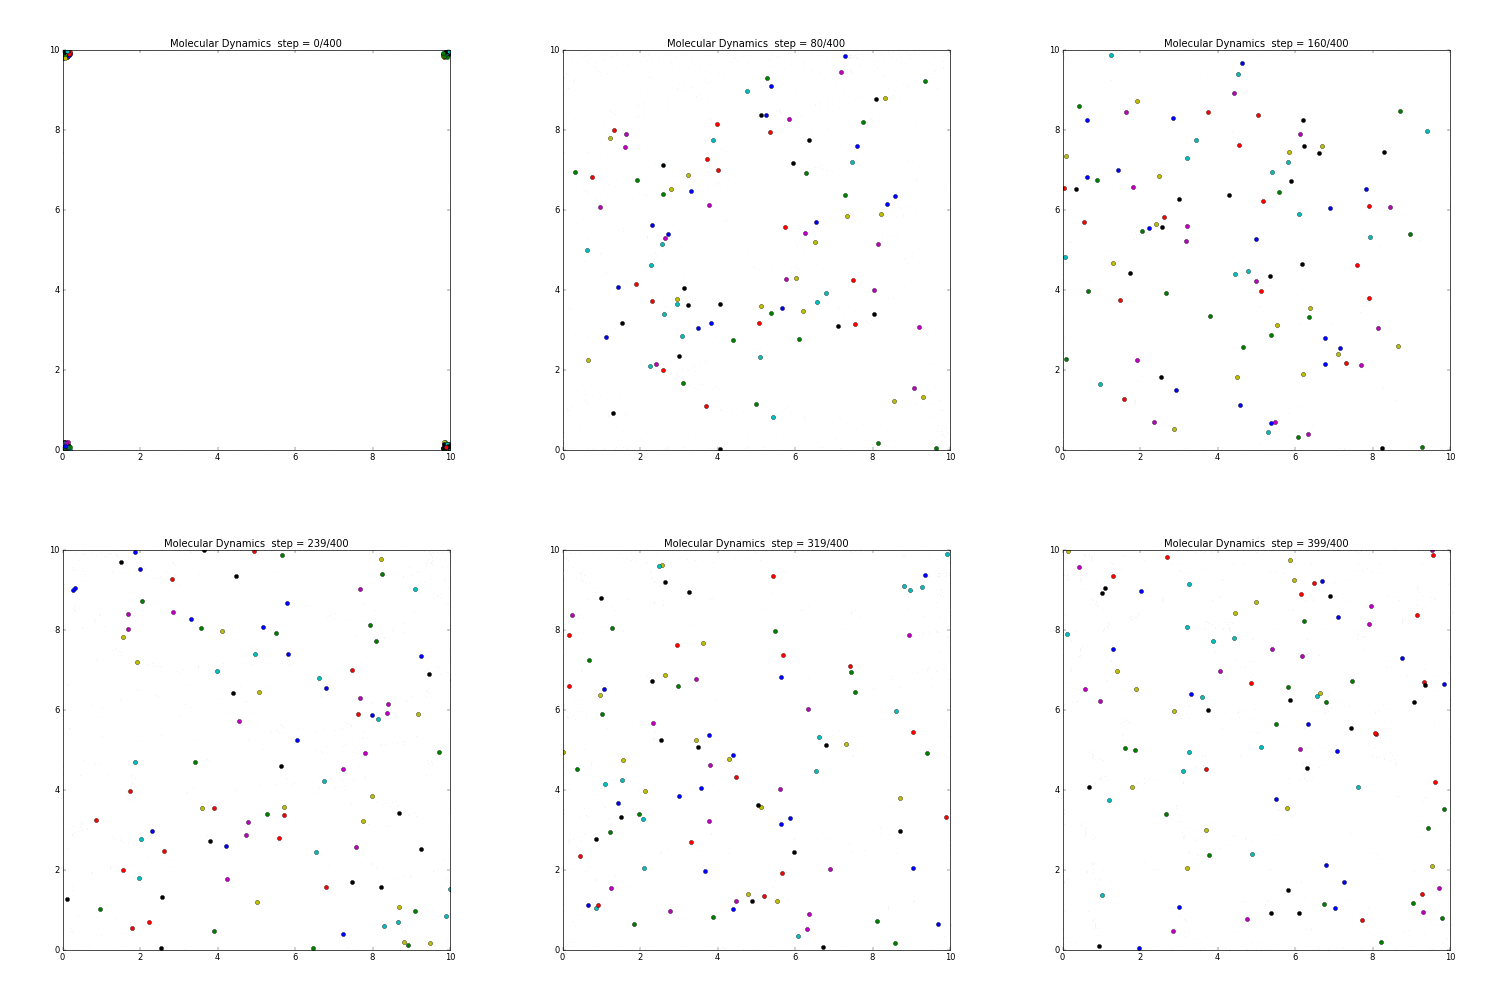
粒子の動きを分子動力学で計算しmatplotlibで可視化してみる。
ただし各粒子間には相互作用は働かないシンプルな系として考える。
速度の計算はベルレ法(参考)。
各粒子はお互いが見えていないので、初速のまま真っ直ぐに飛び続ける。境界を越えたら反対側へ。
|
1 2 3 4 5 6 7 8 9 10 11 12 13 14 15 16 17 18 19 20 21 22 23 24 25 26 27 28 29 30 31 32 33 34 35 36 37 38 39 40 41 42 43 44 45 46 47 48 49 50 51 52 53 54 55 56 57 58 59 60 61 62 63 64 65 66 67 68 69 70 71 72 73 74 75 76 77 78 79 80 81 82 83 84 85 86 87 88 89 90 |
#-*- coding:utf-8 -*- import matplotlib.pyplot as plt import numpy as np import random a = 10 Dt = 0.1 #Define xy index PX = 0 PY = 1 VX = 2 VY = 3 FX = 4 FY = 5 def integ(xy): #verlet integration particle_num = len(xy) pnum = 0 while pnum < particle_num: #update velocity xy[pnum][VX] = xy[pnum][VX] + 0.5*Dt*xy[pnum][FX] xy[pnum][VY] = xy[pnum][VY] + 0.5*Dt*xy[pnum][FY] #update position xy[pnum][PX] = xy[pnum][PX] + Dt*xy[pnum][VX] xy[pnum][PY] = xy[pnum][PY] + Dt*xy[pnum][VY] #boundary condition if xy[pnum][PX] > a: xy[pnum][PX] -= a if xy[pnum][PY] > a: xy[pnum][PY] -= a if xy[pnum][PX] < 0: xy[pnum][PX] += a if xy[pnum][PY] < 0: xy[pnum][PY] += a pnum += 1 def update(i, fig_title, xy, total_step): if i != 0: plt.cla() ax.set_xlim(0,10) ax.set_ylim(0,10) integ(xy) nnum = 0 while nnum < len(xy): plt.plot(xy[nnum][PX], xy[nnum][PY], "o") nnum = nnum + 1 plt.title(fig_title + ' step = ' + str(i) + '/' + str(total_step)) def init_set(xy): pnum = 0 xv_sum = 0 yv_sum = 0 particle_num = len(xy) while pnum < particle_num: xy[pnum][PX] = 0 # x-position xy[pnum][PY] = 0 # y-position xy[pnum][VX] = random.uniform(-1,1) # x-velocity xy[pnum][VY] = random.uniform(-1,1) # y-velocity xv_sum += xy[pnum][VX] yv_sum += xy[pnum][VY] xy[pnum][FX] = 0 # x-force xy[pnum][FY] = 0 # y-force pnum += 1 #Total momentum to zero xv_sum = xv_sum / particle_num yv_sum = yv_sum / particle_num pnum = 0 while pnum < particle_num: xy[pnum][VX] = xy[pnum][VX] - xv_sum xy[pnum][VY] = xy[pnum][VY] - yv_sum pnum += 1 if __name__ == "__main__": fig = plt.figure(figsize = (10, 6)) fig.set_size_inches(10,10) ax = fig.add_subplot(111) perticle_num = 100 xy = [[0 for i in range(6)] for j in range(perticle_num)] init_set(xy) total_step =400 ani = anm.FuncAnimation(fig, \ update, fargs = ('Molecular Dynamics ', xy, total_step), \ interval = 10, frames = total_step) plt.show() #ani.save("Sample_MD.gif", writer = 'imagemagick', dpi=50) |
実行の結果は下記。

matplotlibで生成したgifをwebへアップする際に、
少しでもgifファイルサイズを小さくするため下記サイトを使ってみた。
結果は下記。余白が多いようなgifアニメは結構圧縮が効く様子。
930KB -> 530KB
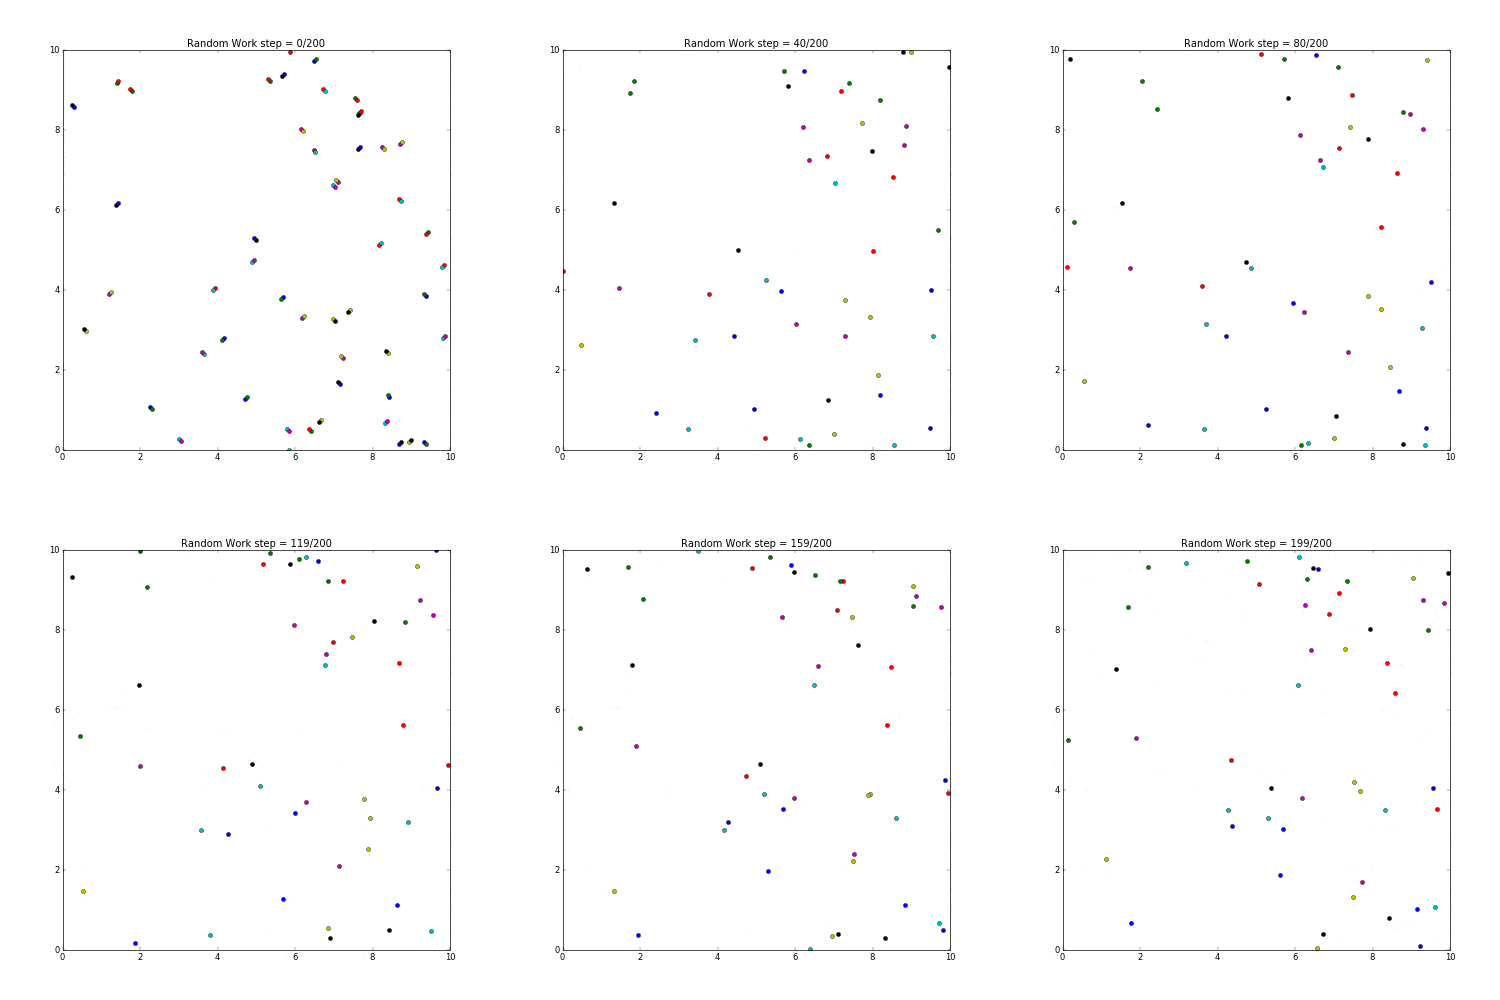
ランダムウォークをmatplotlibで表示してみた。
各粒子の動作は乱数で上下左右に動くように設定。
マシンが非力なせいか、粒子数を増やすとgif作成にやたら時間がかかる。
|
1 2 3 4 5 6 7 8 9 10 11 12 13 14 15 16 17 18 19 20 21 22 23 24 25 26 27 28 29 30 31 32 33 34 35 36 37 38 39 40 41 42 43 44 45 46 47 48 49 50 51 52 53 54 55 56 57 58 59 60 61 62 63 64 |
#-*- coding:utf-8 -*- import matplotlib.animation as anm import matplotlib.pyplot as plt import numpy as np import random def pstep(xy): nnum = 0 pnum = 0 while nnum < len(xy): while pnum < 2: rr = random.random() if rr > 0.5: xy[nnum][pnum] = xy[nnum][pnum] + 0.05 else: xy[nnum][pnum] = xy[nnum][pnum] - 0.05 if xy[nnum][pnum] < 0: xy[nnum][pnum] += 10 if xy[nnum][pnum] > 10: xy[nnum][pnum] -= 10 pnum = pnum + 1 pnum = 0 nnum = nnum + 1 def update(i, fig_title, A, xy, total_step): if i != 0: plt.cla() ax.set_xlim(0,10) ax.set_ylim(0,10) pstep(xy) nnum = 0 while nnum < len(xy): plt.plot(xy[nnum][0], xy[nnum][1], "o") nnum = nnum + 1 plt.title(fig_title + ' step = ' + str(i) + '/' + str(total_step)) if __name__ == "__main__": fig = plt.figure(figsize = (10, 6)) fig.set_size_inches(10,10) ax = fig.add_subplot(111) perticle_num = 50 xy = [[0 for i in range(2)] for j in range(perticle_num)] nnum = 0 pnum = 0 while nnum < len(xy): while pnum < 2: xy[nnum][pnum] = random.random() * 10 pnum = pnum + 1 pnum = 0 nnum = nnum + 1 total_step =200 ani = anm.FuncAnimation(fig, \ update, fargs = ('Random Work', 2.0, xy, total_step), \ interval = 100, frames = total_step) ##plt.show() ani.save("Sample_randomwork.gif", writer = 'imagemagick', dpi=50) |
実行した結果が下記。

random work sample by python and matplotlib.
↓こちらのサイトを参考に、そのままの手順でできました。
http://ssmn0621.blogspot.jp/2016/03/cygwinnumpyscipymatplotlib.html
■pipのインストール
%easy_install-2.7 pip
■scipyのインストール
%pip install scipy
■matplotlibのインストール
%easy_install-2.7 matplotlib==2.0.0
■実行テスト
setenv DISPLAY :0.0 #DISPLAY設定
run xwin -multiwindow -noclipboard #xを起動
python rect.py
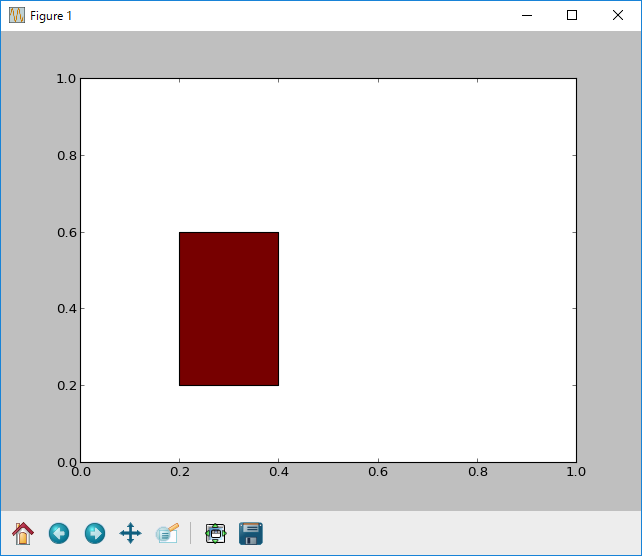
■実行結果

■rect.pyの中身は↓
|
1 2 3 4 5 6 7 8 9 10 11 12 13 14 |
# -*- coding: utf-8 -*- import matplotlib import matplotlib.pyplot as plt def main(): fig = plt.figure() ax = fig.add_subplot(111) # 始点(0.2,0.2)で幅が0.2, 高さが0.4の長方形を描画 rect = plt.Rectangle((0.2,0.2),0.2,0.4,fc="#770000") ax.add_patch(rect) plt.show() if __name__ == '__main__': main() |
※easy_install , pip
共にpython用外部ライブラリのパッケージ管理ツール
easy_installの方が古いらしく、pipはこれらを置き換える
目的で開発されている。