make center line at polygons , using voronoi.
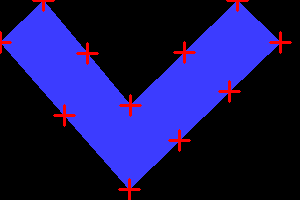
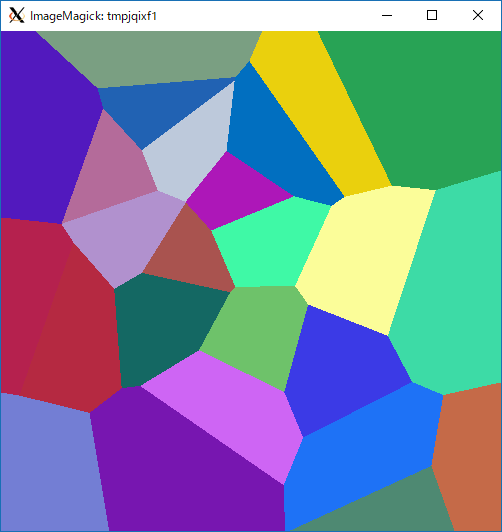
ポリゴンを構成する頂点列から、ポリゴン内に中心線を生成する。中心線の生成にはボロノイ図を用いる。入力としたポリゴン内の長いエッジに対しては細分化を行い、ボロノイ図を生成。生成したボロノイ図を構成するエッジの内、ポリゴン内にあるもののみを抽出すると、そのエッジはポリゴンの中心線のような形状となる。
generate center line in the polygon from the vertex sequence constituting the polygon. at generate we use voronoi diagrams . For long edges in the input polygon, subdivide it and generate Voronoi diagram. When extracting only those in the polygon out of the edges constituting the generated Voronoi diagram, the edge has a shape like the center line of the polygon.
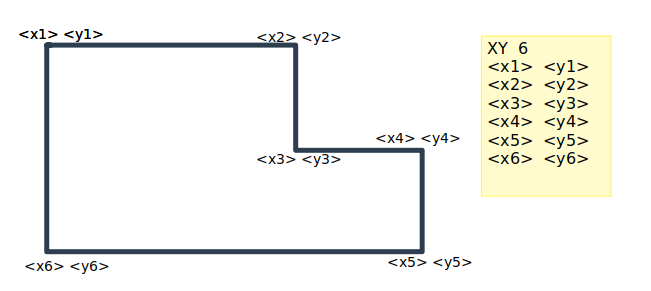
なお、今回扱うポリゴン頂点列のフォーマットしては下記の様なものとしてある。ポリゴンが複数ある場合は、下記を一つのテキストファイルに複数記述することで複数ポリゴンを表現できる。
The format of the polygon vertex sequence handled this time is as follows. If there are multiple polygons, you can express multiple polygons by describing the following in one text file.
XY


....
....
XY .. 固定(fixed)
point num .. ポリゴンを形成する頂点数
(number of vertives forming a polygon)
x1 y1 .. 頂点1つを表すX-Y座標。
(XY coordinates representing one vertex)
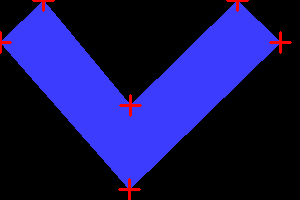
■頂点座標指定のイメージ図(format sample image)
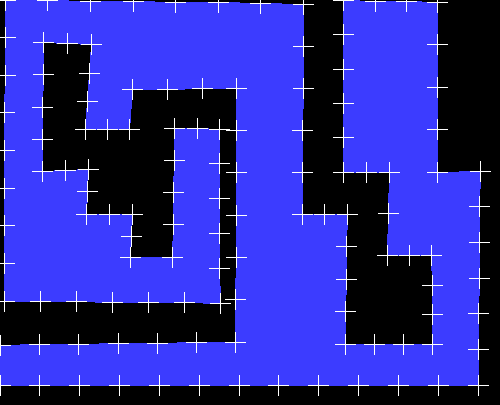
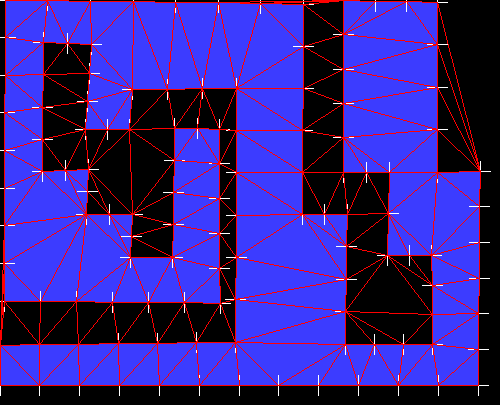
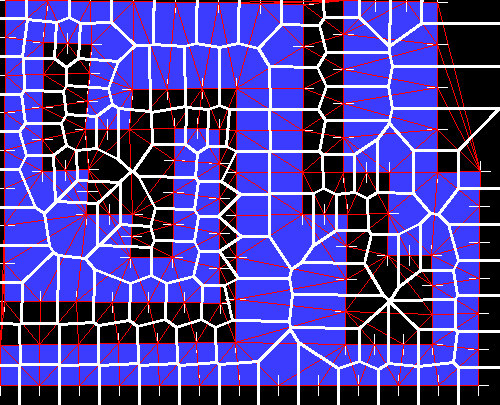
最初に生成する中心線の結果画像を示す。青色がポリゴン図形、白線がボロノイ図、緑線が中心線となる。
At first, show results image of the center line generated. Blue is a polygon figure, a white line is a Voronoi diagram, and a green line is a center line.
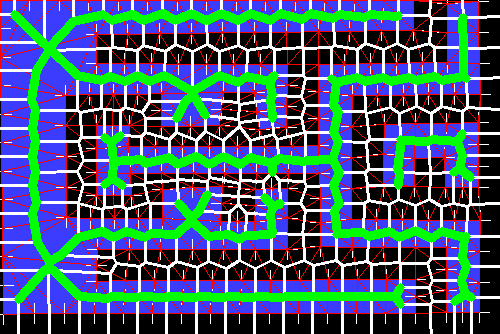
入力としたポリゴン頂点を表すテキストファイルは下記
the input polygon vertex text is as follow URL.
http://hello-python.com/imgs/201901/point_list
■sample code
import cv2
import sys
import math
import numpy as np
def isEven(num):
if num % 2 == 0:
return True
else:
return False
def calc_dist(v):
x1 = v[0]
y1 = v[1]
x2 = v[2]
y2 = v[3]
xx = x2 - x1
yy = y2 - y1
xxyy = xx*xx + yy*yy
dist = math.sqrt(xxyy)
return dist
def split_vect(v,slen):
tp = np.empty((0,2), float)
dist = calc_dist(v)
if dist < slen:
x1 = v[0]
y1 = v[1]
tp = np.append(tp, np.array([[x1,y1]]), axis=0)
else:
snum = int(math.ceil(dist/slen))
x1 = v[0]
y1 = v[1]
x2 = v[2]
y2 = v[3]
xx = x2 - x1
yy = y2 - y1
dx = xx/snum
dy = yy/snum
for i in range(snum):
xx = x1 + dx * i
yy = y1 + dy * i
tp = np.append(tp, np.array([[xx,yy]]), axis=0)
return tp
def convert2vector(oarr):
varr = np.empty((0,4), float)
for i in range(len(oarr)):
xx1 = oarr[i][0]
yy1 = oarr[i][1]
if i != len(oarr) -1:
xx2 = oarr[i + 1][0]
yy2 = oarr[i + 1][1]
else:
xx2 = oarr[0][0]
yy2 = oarr[0][1]
i = i + 1
varr = np.append(varr, np.array([[xx1,yy1,xx2,yy2]]), axis=0)
return varr
def convert2vector_s(oarrs):
"""
convert point list to vector list
"""
varrs = []
for oarr in oarrs:
varr = convert2vector(oarr)
varrs.append(varr)
return varrs
def split_longedge(oarrs, slen):
"""
if 2points distance is long than slen,
make new point between 2points.
return new point list.
"""
# -----------------------------------
# convert point list to vector list
# -----------------------------------
varrs = convert2vector_s(oarrs)
# -----------------------------------
# split long vector, and convert vector list to point list
# -----------------------------------
arrs = []
for varr in varrs:
arr = np.empty((0,2),float)
for p in varr:
tp = split_vect(p,slen)
arr = np.append(arr, tp, axis=0)
arrs.append(arr)
return arrs
def adjust_picture_size(arrs,width):
minx = sys.maxsize
miny = sys.maxsize
maxx = -minx
maxy = -miny
for arr in arrs:
for p in arr:
xx = p[0]
yy = p[1]
if xx > maxx:
maxx = xx
if yy > maxy:
maxy = yy
if xx < minx:
minx = xx
if yy < miny:
miny = yy
wx = maxx - minx
wy = maxy - miny
w = width
h = int(w * wy/wx)
# adjust coordinates according to pixel size
for j in range(len(arrs)):
for i in range(len(arrs[j])):
xxx = arrs[j][i][0] - minx
xxx = xxx * (w-20)/wx
arrs[j][i][0] = xxx
yyy = arrs[j][i][1] - miny
yyy = yyy * (h-20)/wy
arrs[j][i][1] = yyy
retval = (arrs, h)
return retval
def isCross(p1,p2,p3,p4):
t1 = (p1[0] - p2[0]) * (p3[1] - p1[1]) + (p1[1] - p2[1]) * (p1[0] - p3[0])
t2 = (p1[0] - p2[0]) * (p4[1] - p1[1]) + (p1[1] - p2[1]) * (p1[0] - p4[0])
t3 = (p3[0] - p4[0]) * (p1[1] - p3[1]) + (p3[1] - p4[1]) * (p3[0] - p1[0])
t4 = (p3[0] - p4[0]) * (p2[1] - p3[1]) + (p3[1] - p4[1]) * (p3[0] - p2[0])
return t1*t2<0 and t3*t4<0
def select_inpol(faces, arrs):
ret_vect = np.empty((0,4), int)
for p in faces:
xx = p[len(p) - 1][0]
yy = p[len(p) - 1][1]
p = np.append(p, np.array([[xx,yy]]), axis=0)
varr = convert2vector(p)
ret_vect = np.vstack((ret_vect, varr))
maxx = maxy = -sys.maxsize
for arr in arrs:
for p in arr:
if p[0] > maxx:
maxx = p[0]
if p[1] > maxy:
maxy = p[1]
maxx = maxx + 100
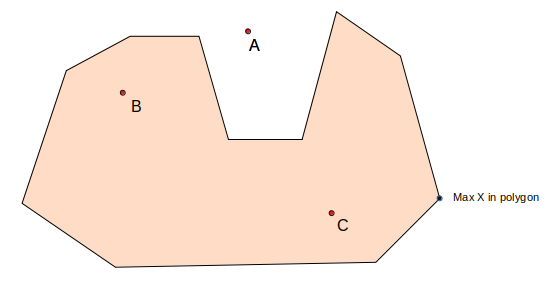
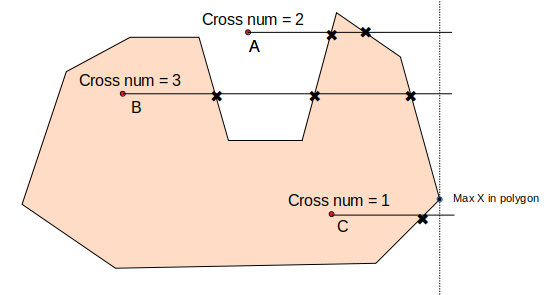
pol_vector_s = convert2vector_s(arrs)
v_in_pol = np.empty((0,4), float)
for vv in ret_vect:
v_st = (vv[0], vv[1])
v_ed = (maxx, vv[1])
cross_cnt = 0
for pol_vector in pol_vector_s:
for pv in pol_vector:
p_st = (pv[0], pv[1])
p_ed = (pv[2], pv[3])
if isCross(v_st, v_ed, p_st, p_ed):
cross_cnt += 1
if isEven(cross_cnt):
continue
else:
v_st = (vv[2], vv[3])
v_ed = (maxx, vv[3])
cross_cnt = 0
for pol_vector in pol_vector_s:
for pv in pol_vector:
p_st = (pv[0], pv[1])
p_ed = (pv[2], pv[3])
if isCross(v_st, v_ed, p_st, p_ed):
cross_cnt += 1
if isEven(cross_cnt):
continue
else:
v_in_pol = np.append(v_in_pol, [vv], axis=0)
return v_in_pol
if __name__ == '__main__':
#Specify the width of Voronoi image in pixel size. Height is
#calculated automatically from input data and specified width.
width = 500
#-------------------
#read input data and stack at ndarray(oarr).
#-------------------
in_data = open("./point_list")
lines = in_data.readlines()
oarr = np.empty((0,2), float)
oarrs = []
pnum = cnt = 0
for i in range(len(lines)):
lines[i].strip()
jj = lines[i].split()
if jj[0] == "XY":
pnum = int(jj[1])
else:
xx = float(jj[0])
yy = float(jj[1])
oarr = np.append(oarr, np.array([[xx,yy]]), axis=0)
cnt += 1
print (pnum,cnt)
if cnt == pnum:
oarrs.append(oarr)
oarr = np.empty((0,2), float)
cnt = 0
i = i + 1
#-------------------
#split long edge. output is arr.
#-------------------
split_length = 0.5
arrs = split_longedge(oarrs, split_length)
#-------------------
#adjust point list coodinate for picture size. output is pts.
#-------------------
ret = adjust_picture_size(arrs,width)
pts_s = ret[0]
hight = ret[1]
#-------------------
#Draw Filled polygon contour.
#-------------------
img = np.zeros((hight, width, 3), np.uint8)
for pts in pts_s:
arr0 = np.empty((0,2), int)
for p in pts:
xx = int(p[0])
yy = int(p[1])
arr0 = np.append(arr0, np.array([[xx,yy]]), axis=0)
cv2.fillPoly(img, [arr0], (255, 60, 60))
cv2.imwrite('001_c_pattern_contour.png', img)
#-------------------
#Draw polygon point mark
#-------------------
img_draw = img.copy()
for pts in pts_s:
for p in pts:
nnn = np.array([ int(p[0]), int(p[1]) ])
cv2.drawMarker(img_draw, tuple(nnn), (255, 255, 255),\
thickness=1)
cv2.imwrite('002_c_point_marker.png', img_draw)
#-------------------
#Make subdivision surface.
#-------------------
rect = (0, 0, width, hight)
subdiv = cv2.Subdiv2D(rect)
for pts in pts_s:
for p in pts:
#print(p)
subdiv.insert((p[0], p[1]))
triangles = subdiv.getTriangleList()
pols = triangles.reshape(-1, 3, 2)
cv2.polylines(img_draw, pols.astype(int), True, (0, 0, 255),\
thickness=1)
cv2.imwrite('003_c_delaunay_traiangle.png', img_draw)
#-------------------
#Make voronoi picture.
#-------------------
faces, centers = subdiv.getVoronoiFacetList([])
cv2.polylines(img_draw, [f.astype(int) for f in faces], True,\
(255, 255, 255), thickness=2)
cv2.imwrite('004_c_voronoi.png', img_draw)
#-------------------
#select polygon inner edge from voronoi img
#-------------------
vlist = select_inpol(faces, arrs)
for p in vlist:
cv2.line(img_draw, (int(p[0]), int(p[1])), (int(p[2]), int(p[3])),\
(0,255,0),thickness=7)
cv2.imwrite('005_c_inpol_vol_pnt.png', img_draw)