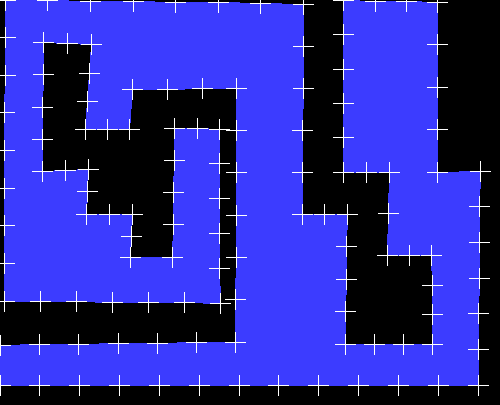
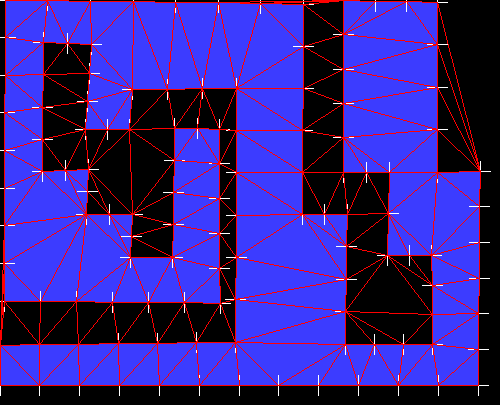
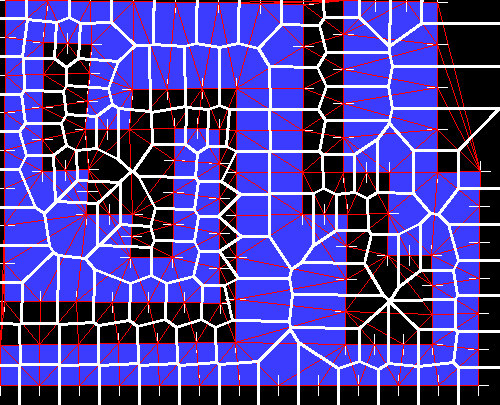
テキスト形式で保存された、polygonを形成する頂点列から、ボロノイ図を作成する。初めに入力とする座標データ、次に生成結果の画像(入力図形のダンプや、結果のボロノイ図)、最後に使用したコードを示す。
Create a Voronoi diagram from a vertex sequence that forms a polygon, saved in text format. The first coordinate data input, the resulting image (input figure dump, result Voronoi diagram), and the last used code are shown.
■input point list(x-y coodinate)
-125.458 131.465
-125.474 135.003
-122.966 135.026
-122.974 132.982
-123.492 132.974
-123.516 134.484
-124.011 134.492
-123.988 133.981
-124.515 133.981
-124.491 133.454
-125.026 133.477
-125.018 131.968
-124.459 131.992
-124.53 132.99
-124.019 132.982
-123.98 132.518
-122.769 132.503
-122.785 135.482
-125.513 135.522
-125.521 135.986
-119.97 135.986
-119.947 133.477
-120.442 133.485
-120.442 131.496
-121.527 131.473
-121.535 133.485
-121 133.485
-121.016 134.468
-120.505 134.468
-120.497 135.506
-121.511 135.506
-121.488 133.981
-122.006 133.981
-121.999 131.512
-125.458 131.465
■output picture
001_pattern_contour.png(input pattern)

002_point_marker.png(after split long edge points)

003_delaunay_traiangle.png

004_voronoi.png

■sample code
|
1 2 3 4 5 6 7 8 9 10 11 12 13 14 15 16 17 18 19 20 21 22 23 24 25 26 27 28 29 30 31 32 33 34 35 36 37 38 39 40 41 42 43 44 45 46 47 48 49 50 51 52 53 54 55 56 57 58 59 60 61 62 63 64 65 66 67 68 69 70 71 72 73 74 75 76 77 78 79 80 81 82 83 84 85 86 87 88 89 90 91 92 93 94 95 96 97 98 99 100 101 102 103 104 105 106 107 108 109 110 111 112 113 114 115 116 117 118 119 120 121 122 123 124 125 126 127 128 129 130 131 132 133 134 135 136 137 138 139 140 141 142 143 144 145 146 147 148 149 150 151 152 153 154 155 156 157 158 159 160 161 162 163 164 165 166 167 168 169 170 171 172 173 174 175 176 177 178 179 180 181 182 183 184 185 186 187 188 189 190 191 192 193 194 195 196 197 198 |
import cv2 import sys import math import numpy as np def calc_dist(v): x1 = v[0] y1 = v[1] x2 = v[2] y2 = v[3] xx = x2 - x1 yy = y2 - y1 xxyy = xx*xx + yy*yy dist = math.sqrt(xxyy) return dist def split_vect(v,slen): tp = np.empty((0,2), float) dist = calc_dist(v) if dist < slen: x1 = v[0] y1 = v[1] tp = np.append(tp, np.array([[x1,y1]]), axis=0) else: snum = int(math.ceil(dist/slen)) x1 = v[0] y1 = v[1] x2 = v[2] y2 = v[3] xx = x2 - x1 yy = y2 - y1 dx = xx/snum dy = yy/snum for i in range(snum): xx = x1 + dx * i yy = y1 + dy * i tp = np.append(tp, np.array([[xx,yy]]), axis=0) return tp def split_longedge(oarr, slen): """ if 2points distance is long than slen, make new point between 2points. return new point list. """ # ----------------------------------- # convert point list to vector list # ----------------------------------- varr = np.empty((0,4), float) for i in range(len(oarr)): xx1 = oarr[i][0] yy1 = oarr[i][1] if i != len(oarr) -1: xx2 = oarr[i + 1][0] yy2 = oarr[i + 1][1] else: break varr = np.append(varr, np.array([[xx1,yy1,xx2,yy2]]), axis=0) i = i + 1 # ----------------------------------- # split long vector, and convert vector list to point list # ----------------------------------- arr = np.empty((0,2),float) for p in varr: tp = split_vect(p,slen) arr = np.append(arr, tp, axis=0) arr0 = np.array([[arr[0][0], arr[0][1]]]) arr = np.append(arr, arr0, axis=0) return arr def adjust_picture_size(arr,width): minx = sys.maxsize miny = sys.maxsize maxx = -minx maxy = -miny for p in arr: xx = p[0] yy = p[1] if xx > maxx: maxx = xx if yy > maxy: maxy = yy if xx < minx: minx = xx if yy < miny: miny = yy wx = maxx - minx wy = maxy - miny w = width h = int(w * wy/wx) # adjust coordinates according to pixel size for i in range(len(arr)): xxx = arr[i][0] - minx xxx = xxx * (w-20)/wx arr[i][0] = xxx yyy = arr[i][1] - miny yyy = yyy * (h-20)/wy arr[i][1] = yyy retval = (arr, h) return retval if __name__ == '__main__': #Specify the width of Voronoi image in pixel size. Height is #calculated automatically from input data and specified width. width = 500 #------------------- #read input data and stack at ndarray(oarr). #------------------- in_data = open("./pol_list") lines = in_data.readlines() oarr = np.empty((0,2), float) for i in range(len(lines)): lines[i].strip() jj = lines[i].split() xx = float(jj[0]) yy = float(jj[1]) oarr = np.append(oarr, np.array([[xx,yy]]), axis=0) i = i + 1 #------------------- #split long edge. output is arr. #------------------- split_length = 0.5 arr = np.empty((0,2),float) arr = split_longedge(oarr, split_length) #------------------- #adjust point list coodinate for picture size. output is pts. #------------------- ret = adjust_picture_size(arr,width) pts = ret[0] hight = ret[1] #------------------- #Draw Filled polygon contour. #------------------- img = np.zeros((hight, width, 3), np.uint8) arr0 = np.empty((0,2), int) for p in pts: xx = int(p[0]) yy = int(p[1]) arr0 = np.append(arr0, np.array([[xx,yy]]), axis=0) cv2.fillPoly(img, [arr0], (255, 60, 60)) cv2.imwrite('001_pattern_contour.png', img) #------------------- #Draw polygon point mark #------------------- img_draw = img.copy() for p in pts: nnn = np.array([ int(p[0]), int(p[1]) ]) cv2.drawMarker(img_draw, tuple(nnn), (255, 255, 255),\ thickness=1) cv2.imwrite('002_point_marker.png', img_draw) #------------------- #Make subdivision surface. #------------------- rect = (0, 0, width, hight) subdiv = cv2.Subdiv2D(rect) for p in pts: print(p) subdiv.insert((p[0], p[1])) triangles = subdiv.getTriangleList() pols = triangles.reshape(-1, 3, 2) cv2.polylines(img_draw, pols.astype(int), True, (0, 0, 255),\ thickness=1) cv2.imwrite('003_delaunay_traiangle.png', img_draw) #------------------- #Make voronoi picture. #------------------- faces, centers = subdiv.getVoronoiFacetList([]) cv2.polylines(img_draw, [f.astype(int) for f in faces], True,\ (255, 255, 255), thickness=2) cv2.imwrite('004_voronoi.png', img_draw) |
|
1 |
arr = split_longedge(oarr, split_length) |
上記の関数では、頂点列で表すPolygon図形を構成するエッジのうち、任意の長さ以上のエッジに対して分割し頂点を増やすことを行う
In the above function, divide the edges of arbitrary length out of the edges constituting the polygon figure represented by the vertex sequence and increase the number of vertices.input first argument is ndarray(xy point list),second is split length. If distance between two points constituting an edge far than this length, add new point at between two point, and split long edge.
|
1 2 3 |
ret = adjust_picture_size(arr,width) pts = ret[0] hight = ret[1] |
上記の関数では、生成するボロノイ図の画像データのに合わせて、頂点列の座標を変換(倍率変換)している。2つ目引数に指定した値が生成画像の横幅となる。戻り値は配列となっており、一つ目は変換結果のndarray,2つ目は画像の高さ。
In the above function, the coordinates of the vertex sequence are converted (magnification conversion) in accordance with the image data of the generated Voronoi diagram. The value specified for the second argument is the width of the generated image.The return value is an array, the first is the ndarray of the conversion result, the second is the height of the image.
